Markets are moving faster than ever, and investors are searching for clarity in a landscape shaped by innovation alerts, shifting capital flows, and evolving portfolio strategies. If you’re looking to understand where smart money is heading—and how to position your assets accordingly—this article is built for you.
Today’s challenge isn’t access to information; it’s knowing which signals matter. From capital finance fundamentals to wealth growth perspectives, separating durable trends from short-term noise requires disciplined analysis and a strong grasp of risk adjusted return models. Without that foundation, even promising opportunities can erode long-term performance.
In this piece, we break down the most relevant innovation and capital allocation insights, explain what they mean for portfolio construction, and share practical portfolio management hacks you can apply immediately. Our approach draws on structured financial frameworks and data-driven evaluation methods to ensure you’re not just chasing returns—but building sustainable, risk-aware growth.
Smart investing starts with context, not just returns. A stock that gains 12% sounds impressive; however, if it swings wildly, that return may mask serious risk. That’s where risk adjusted return models come in. The Sharpe ratio measures excess return per unit of total volatility. Meanwhile, the Sortino ratio refines this by focusing only on downside risk. Treynor, in contrast, evaluates returns against market risk, or beta. Together, these tools translate complexity into clarity (think Moneyball for your portfolio). Use them consistently, and you replace guesswork with disciplined, data-driven decisions. Pro tip: compare ratios across similar asset classes for accuracy.
The Sharpe Ratio is one of the simplest ways to understand whether your returns are actually worth the ride. In plain terms, it measures how much return you earn for each unit of total risk, where total risk means standard deviation, or how wildly prices swing around their average.
So what question does it answer? Essentially: Am I being adequately compensated for the total volatility of this investment?
Think of it like fuel efficiency. It is not just about how far your car traveled, but how much fuel it burned to get there. A portfolio that surges and crashes may reach the same destination as a steadier one, yet it consumed far more “fuel” in stress and uncertainty.
Here is a quick example. Fund A earns 10% with 15% volatility. Fund B earns 8% with 5% volatility. When you divide return by volatility, Fund A’s ratio is lower than Fund B’s. In other words, Fund B delivers more return per unit of risk.
Some investors argue raw returns are all that matter. However, risk adjusted return models show that consistency often builds wealth reliably over time. Pro tip: use the Sharpe Ratio to compare diversified funds, not single speculative stocks.
The Sortino Ratio: Focusing Only on the Risk That Matters
The Sortino Ratio refines how we think about risk. Unlike the Sharpe Ratio, it measures return relative to downside deviation—that is, volatility from negative returns only. In simple terms, it asks: How much return am I earning for each unit of bad risk I’m taking?
Downside deviation means the variability of returns that fall below a target (often the risk-free rate). If an investment surges upward, Sortino doesn’t treat that as a flaw. (After all, no one complains about their stock “misbehaving” on the upside.)
Critics argue that ignoring total volatility paints an incomplete picture. They prefer broader risk adjusted return models that account for all price swings, noting that extreme upside spikes can signal instability. Fair point. But for investors focused on capital preservation, upside swings aren’t the threat—losses are.
Consider two funds with identical Sharpe Ratios. Fund A swings wildly up and down. Fund B declines less frequently but still achieves similar returns. Fund B will likely post a higher Sortino Ratio, signaling a smoother ride for risk-averse investors.
Use Sortino when:
- Evaluating high-growth stocks or asymmetrical return profiles.
Pro tip: Pair it with drawdown analysis for a fuller picture of loss potential.
Beta-Driven Insights: The Treynor Ratio and CAPM

Before you can judge performance, you need to understand Beta. Beta measures systematic risk—the portion of risk driven by overall market movements. A Beta of 1 means the asset moves with the market. Greater than 1? It’s more volatile than the market. Less than 1? It tends to move more calmly. Think Tesla versus a utility stock—very different rides.
Now let’s compare tools.
Treynor Ratio vs. CAPM
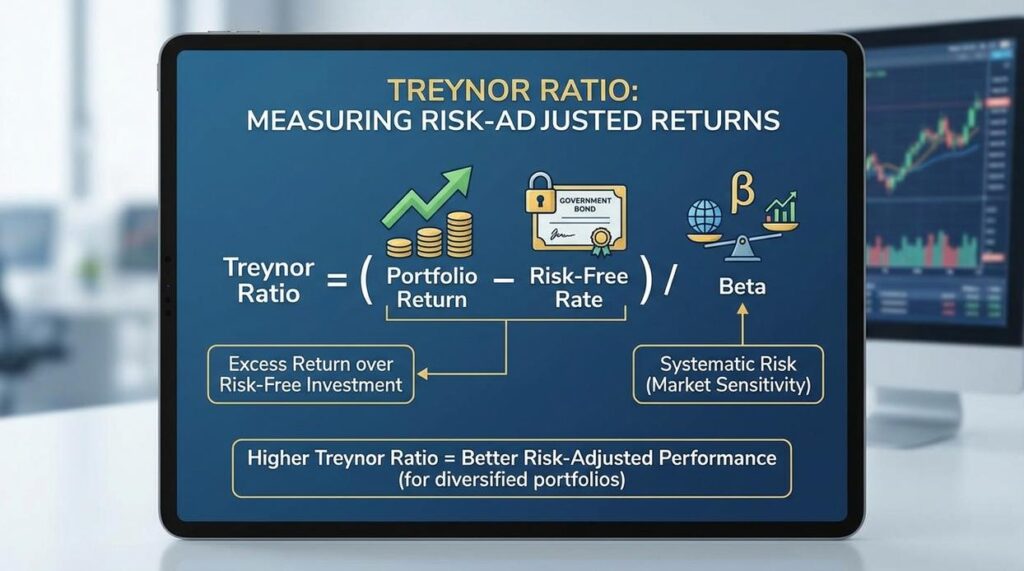
- Treynor Ratio: Measures excess return earned per unit of systematic risk (Beta).
- CAPM (Capital Asset Pricing Model): Estimates the expected return based on Beta and market risk.
Here’s the core question the Treynor Ratio answers: Is this specific asset providing enough return to justify the market risk it adds to my already diversified portfolio?
CAPM, on the other hand, sets the benchmark. It tells you what return you should expect for taking on that level of Beta risk. If an asset’s actual return exceeds the CAPM estimate, it may be undervalued. If it falls short, you might be overpaying for volatility (and no one enjoys that surprise).
In simple terms:
- CAPM = Theoretical fair return
- Treynor = Performance efficiency relative to Beta
Some argue Beta is too simplistic and ignores company-specific risk. Fair point. But in a well-diversified portfolio, unsystematic risk is largely diversified away—making Beta highly relevant. That’s why Treynor works best when evaluating a single stock or fund addition, not an entire portfolio.
Among risk adjusted return models, this pairing offers clarity: CAPM sets expectations; Treynor judges results. For deeper valuation context, revisit an introduction to discounted cash flow modeling.
A Practical Decision Framework
Choosing between risk adjusted return models doesn’t have to feel like decoding Wall Street math.
Here’s how to match the tool to the task:
- Comparing diversified portfolios? Start (and end) with the Sharpe Ratio. It measures return per unit of total volatility. If Portfolio A has a higher Sharpe than Portfolio B, it delivered more return for each unit of risk taken (that’s why institutions cite it so often).
- Risk-averse? Use the Sortino Ratio. Unlike Sharpe, it only penalizes downside volatility—what investors actually lose sleep over. If you care more about drawdowns than upside swings, this is your lens.
- Adding a single stock? The Treynor Ratio isolates market risk (beta). It tells you whether that stock improves returns relative to its contribution to overall portfolio volatility.
- Valuing one asset? Apply CAPM to judge whether expected return fairly compensates for market risk.
Key takeaway: These tools work best together, giving you a clearer, layered view of risk and reward.
By now, you can look past headline returns and think like a portfolio manager. In other words, you are measuring not just how much an investment earned, but how bumpy the ride was. Standard deviation shows how widely returns swing around the average. Beta compares a holding’s movements to the broader market.
That’s where risk adjusted return models come in. They combine return and volatility into metrics like the Sharpe and Treynor ratios. So instead of chasing flashy gains, you evaluate efficiency.
Start small. Pull the standard deviation and Beta for one holding, and calculate ratios to set a baseline.
Turning Insight Into Smarter Portfolio Decisions
You set out to better understand how innovation alerts, capital finance fundamentals, and portfolio management strategies work together to strengthen long-term wealth building. Now you have a clearer framework for evaluating opportunities, managing downside exposure, and using risk adjusted return models to make more disciplined investment decisions.
The real challenge isn’t finding opportunities — it’s knowing which ones truly compensate you for the risk you’re taking. Without a structured approach, volatility, emotional decision-making, and poor allocation can quietly erode returns over time.
That’s why applying structured analysis, tracking performance consistently, and refining your allocation strategy are essential next steps. When you combine forward-looking innovation insights with proven capital management principles, you position your portfolio for smarter, more resilient growth.
If you’re serious about improving performance while controlling risk, now is the time to act. Leverage trusted market insights, apply disciplined portfolio frameworks, and use data-backed tools designed to strengthen long-term results. Investors who rely on structured, proven strategies consistently outperform those who rely on instinct alone.
Start refining your portfolio strategy today — make every dollar work harder, smarter, and with purpose.
 Chief Investment Strategist
Darrin Melvinevo is the kind of writer who genuinely cannot publish something without checking it twice. Maybe three times. They came to wealth growth perspectives through years of hands-on work rather than theory, which means the things they writes about — Wealth Growth Perspectives, Expert Breakdowns, Innovation Alerts, among other areas — are things they has actually tested, questioned, and revised opinions on more than once.
That shows in the work. Darrin's pieces tend to go a level deeper than most. Not in a way that becomes unreadable, but in a way that makes you realize you'd been missing something important. They has a habit of finding the detail that everybody else glosses over and making it the center of the story — which sounds simple, but takes a rare combination of curiosity and patience to pull off consistently. The writing never feels rushed. It feels like someone who sat with the subject long enough to actually understand it.
Outside of specific topics, what Darrin cares about most is whether the reader walks away with something useful. Not impressed. Not entertained. Useful. That's a harder bar to clear than it sounds, and they clears it more often than not — which is why readers tend to remember Darrin's articles long after they've forgotten the headline.
Chief Investment Strategist
Darrin Melvinevo is the kind of writer who genuinely cannot publish something without checking it twice. Maybe three times. They came to wealth growth perspectives through years of hands-on work rather than theory, which means the things they writes about — Wealth Growth Perspectives, Expert Breakdowns, Innovation Alerts, among other areas — are things they has actually tested, questioned, and revised opinions on more than once.
That shows in the work. Darrin's pieces tend to go a level deeper than most. Not in a way that becomes unreadable, but in a way that makes you realize you'd been missing something important. They has a habit of finding the detail that everybody else glosses over and making it the center of the story — which sounds simple, but takes a rare combination of curiosity and patience to pull off consistently. The writing never feels rushed. It feels like someone who sat with the subject long enough to actually understand it.
Outside of specific topics, what Darrin cares about most is whether the reader walks away with something useful. Not impressed. Not entertained. Useful. That's a harder bar to clear than it sounds, and they clears it more often than not — which is why readers tend to remember Darrin's articles long after they've forgotten the headline.